


Let us know if this sounds familiar: You’ve just gone through months of conceptualizing, planning, wire framing, design, and development. You’ve hyped up your website launch, and you finally feel like it’s ready for the World. You launch. Congratulations! But wait, what’s this? Users aren’t responding the way you want them to. This brand new, beautiful website you’re so incredibly proud of isn’t meeting any of your end goals. Are you getting traffic? You check. Yep, tons. You frantically check your bounce rate. 72%. Yikes, that’s kind of high. You dig deeper. The users that are sticking around aren’t for very long. The worst part? You aren’t receiving any of the ecommerce sales, form conversions, or phone calls you anticipated. Total. Disaster.
This typically is a huge red flag of a much greater problem that all the marketing in the world can’t solve – your user experience. That’s right, despite having a new site with all the beautiful bells and whistles you dreamed of, it can still turn out to be a total flunk. There could be a myriad of reasons why, but ultimately the user experience you determined was the perfect fit for your visitors simply isn’t.
In the not so distant past, marketers and designers often turned to the not-so-reliable in-page analytics provided by Google Analytics for answers. Or, deciding how to make favorable user experience changes turned into a (not so) simple guessing game. If lucky, making minor UX adjustments here and there would eventually lead to users completing the website’s original end goal. Alternatively, as a last resort, businesses would just scrap everything and start over, which we all know is a waste of time and money.
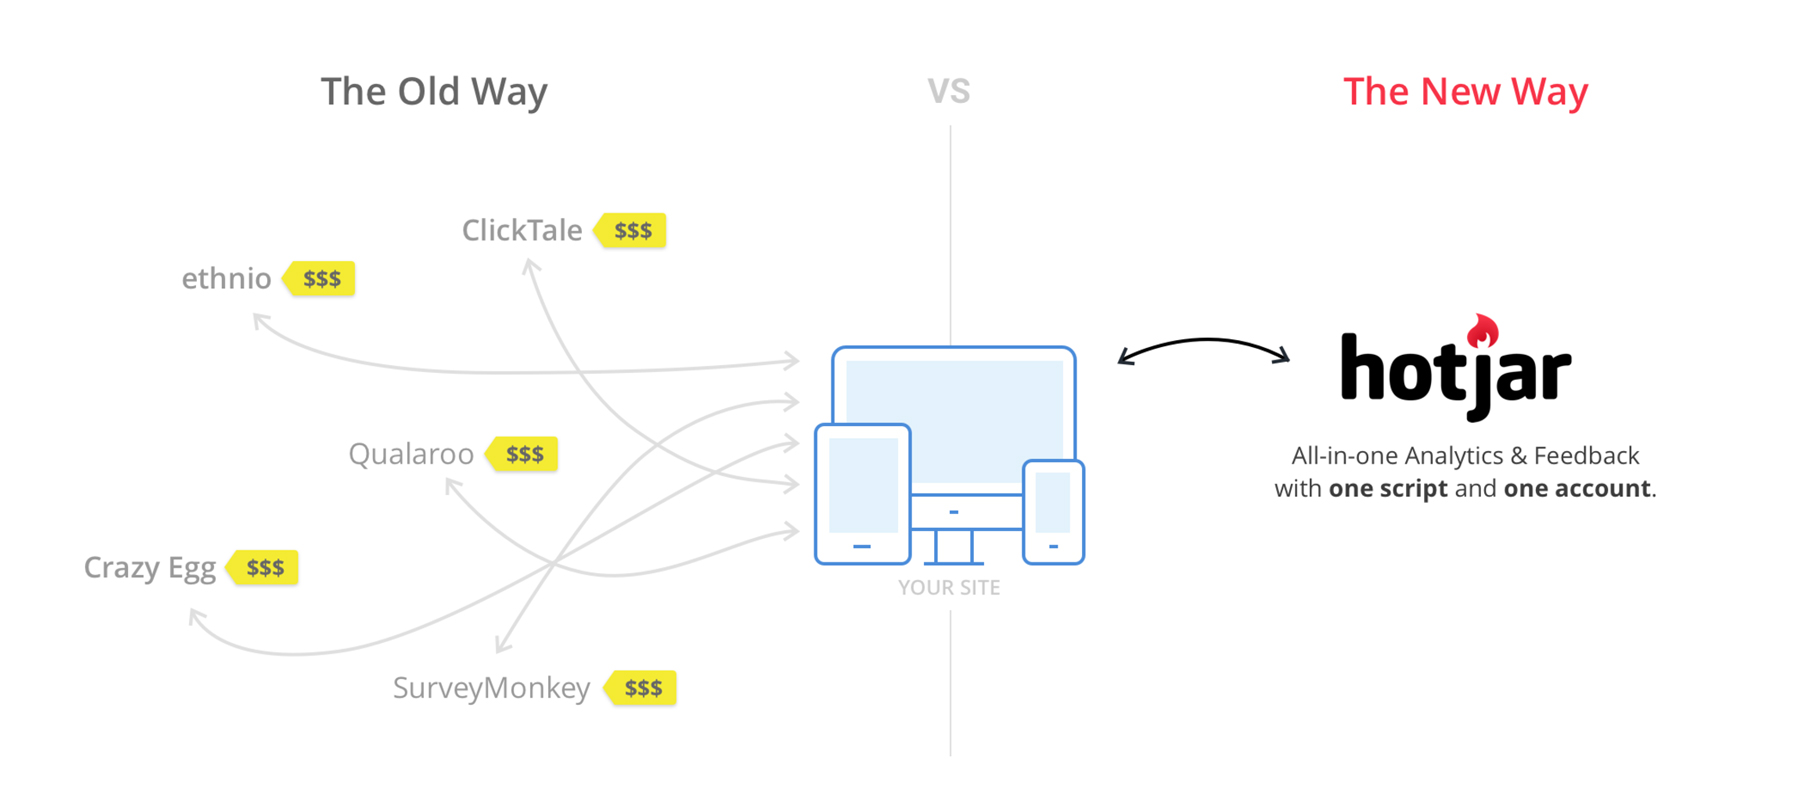
Enter Hotjar, a robust analytics and website feedback tool giving you a bird’s eye view of user interaction with your website or web application. Hotjar’s powerful features are broken down into two categories which are all housed within one convenient and easy to use web application. The first, “analysis,” includes heatmaps, visitor recordings, funnels, and form analytics. The second, “feedback,” includes real-time instant feedback, polls, surveys, and recruiting for user-based quality assurance testing. Although far from alone in the advanced web analytics application space, Hotjar has remained a leader since its 2015 launch. In 2025, businesses now choose between premium tools like Hotjar and powerful free alternatives like Microsoft Clarity, depending on their needs for feedback tools, budget, and integration requirements.
On an individual basis, each of Hotjar’s features provides invaluable insights on how users interact with your site. When used in conjunction with one another, the features can stitch together a meaningful story that tells how, why, and where your site can make serious changes to improve user experience. No more blind changes, no more guessing games.
In this part one of a two-part series on Hotjar, we’ll be taking a closer look at how to setup the software and utilize the analysis features that make this such a great tool.
Hotjar vs. Microsoft Clarity: Choosing Your Website Heatmap Tool in 2025
Before we dive into setup, let’s address the biggest question in 2025: Should you use Hotjar or Microsoft Clarity?
Both offer website heatmaps, click tracking, scroll maps, and session recordings—but they serve different use cases.
Quick Comparison
| Feature | Hotjar | Microsoft Clarity |
| Cost | Free tier (35 daily sessions) Paid: $39–$99+/month | Completely free, unlimited sessions |
| Best For | Agencies, e-commerce, teams needing surveys | High-traffic sites, Microsoft users, tight budgets |
| Feedback Tools | ✅ Surveys, polls, widgets | ❌ None |
| Form Analytics | ✅ Field-level drop-offs | ⚠️ Basic (via recordings only) |
| AI Insights (2025) | Auto-detects rage clicks, u-turns | Auto-surfaces dead clicks, excessive scrolling |
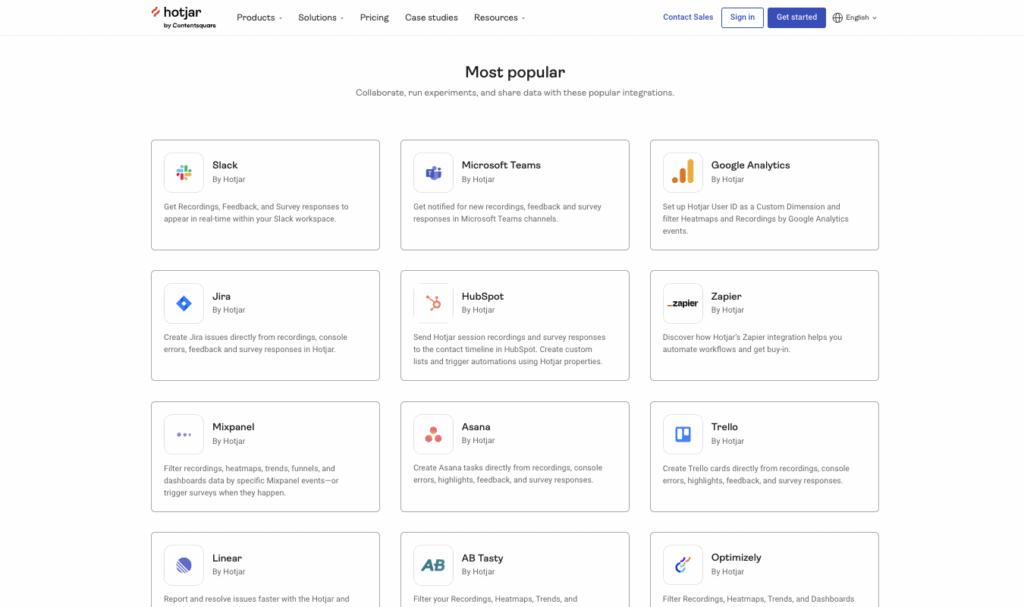
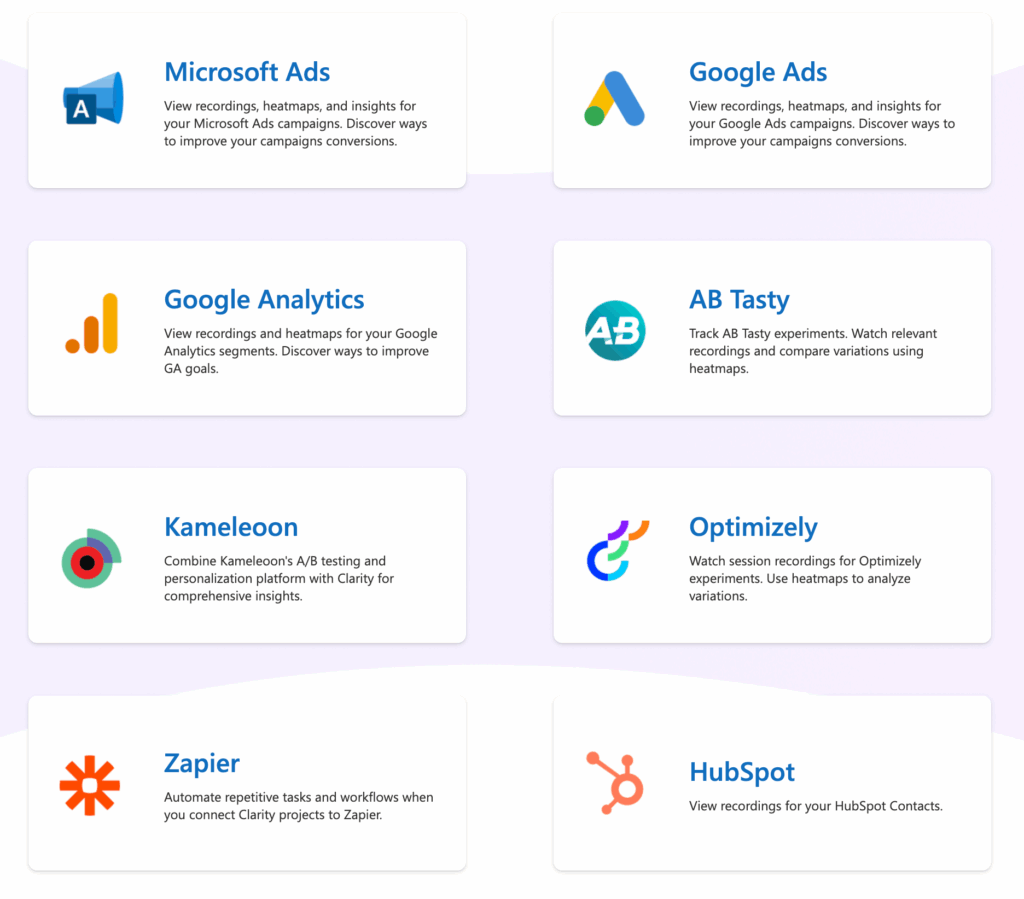
| Integrations | GA4, Shopify, HubSpot, WordPress | GA4, Azure, Microsoft Ads |
| Data Retention | 365 days (paid plans) | 30 days (export to Azure for longer) |
When to Choose Hotjar
- You need feedback tools (surveys/polls) to ask users why they behave a certain way
- Form optimization is critical (checkout flows, lead gen forms)
- You’re an agency managing multiple client sites
- Budget exists for $32–$80/month
When to Choose Microsoft Clarity
- You have zero budget for analytics tools
- You need unlimited recordings for high-traffic sites (100k+ sessions/month)
- You’re already using Microsoft ecosystem (Azure, Advertising)
- You only need click/scroll maps and recordings (no surveys)
The 2025 Hybrid Approach
Many teams now run both simultaneously:
- Clarity for continuous free monitoring across all pages
- Hotjar for targeted deep-dives with surveys when you need user feedback
Example: Use Clarity’s AI to auto-detect problem pages (“Dead clicks up 40% on checkout”), then deploy Hotjar surveys on that page to ask abandoners why they left.
Privacy & Compliance (2025)
Both tools are GDPR/CCPA compliant with:
✅ IP anonymization enabled by default
✅ Automatic PII masking in recordings (passwords, credit cards)
✅ Consent Mode v2 support (required for EU traffic since March 2024)
Action item: Update your privacy policy to disclose heatmap/recording usage.
Bottom line for most businesses: Start with Microsoft Clarity’s free tier to validate heatmap value, then upgrade to Hotjar when you need surveys or advanced form analytics.
Now let’s walk through setup…
Getting Started
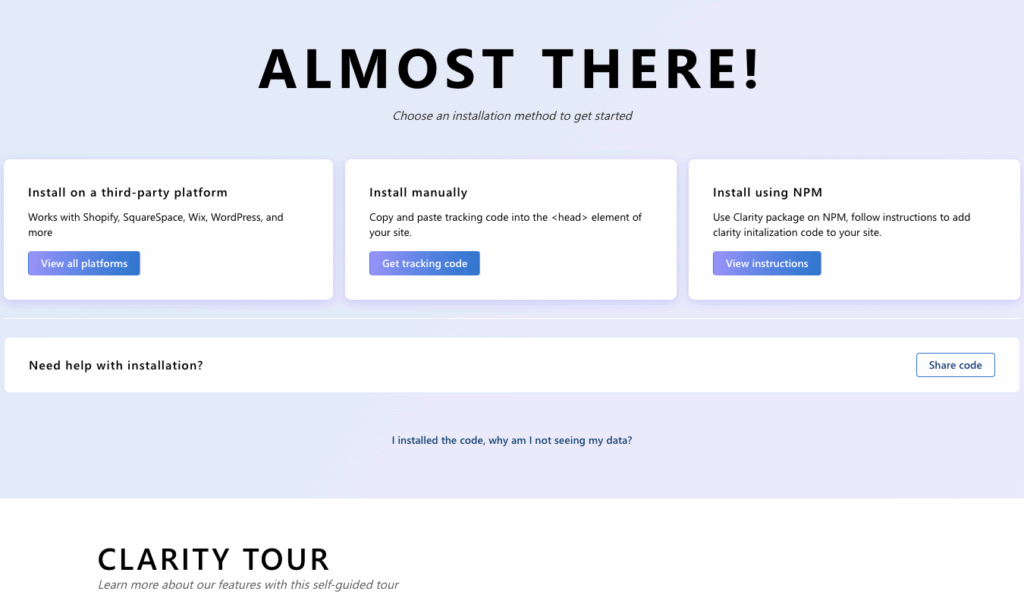
Getting Hotjar installed on your site is relatively simple, and if you have an easy-to-manage Content Management System (CMS) like WordPress, it’s literally the click of a few buttons. Whether or not you understand HTML or JavaScript, Hotjar created an easy to follow guide for manual installation as well as nearly every popular CMS you can think of. After you’ve implemented the code, Hotjar provides a verification tool so you can be sure it’s been installed correctly.
After the tracking code has been successfully implemented, it’s time to start setting up each of Hotjar’s features. Again, Hotjar makes this simple and walks you through the process step-by-step. Our advice would be to start with both Heatmaps and Visitor Recordings, then work your way into the more advanced features from there. It’s also important to get those two features implemented quickly after the tracking code has been implemented, that way you can start gathering user insights right away.
Heatmaps
Imagine a Doppler radar map’s measurement of extreme to mild weather in your area. Typically, the most extreme weather conditions are represented by deep, dark colors, while the milder weather is colored with lighter and less severe hues. Now take that same concept and apply it as an overlay of your website. That’s exactly what a heatmap is. A weather report of your website that measures the hottest (and coolest) user clicks, taps, movement, and scrolls.
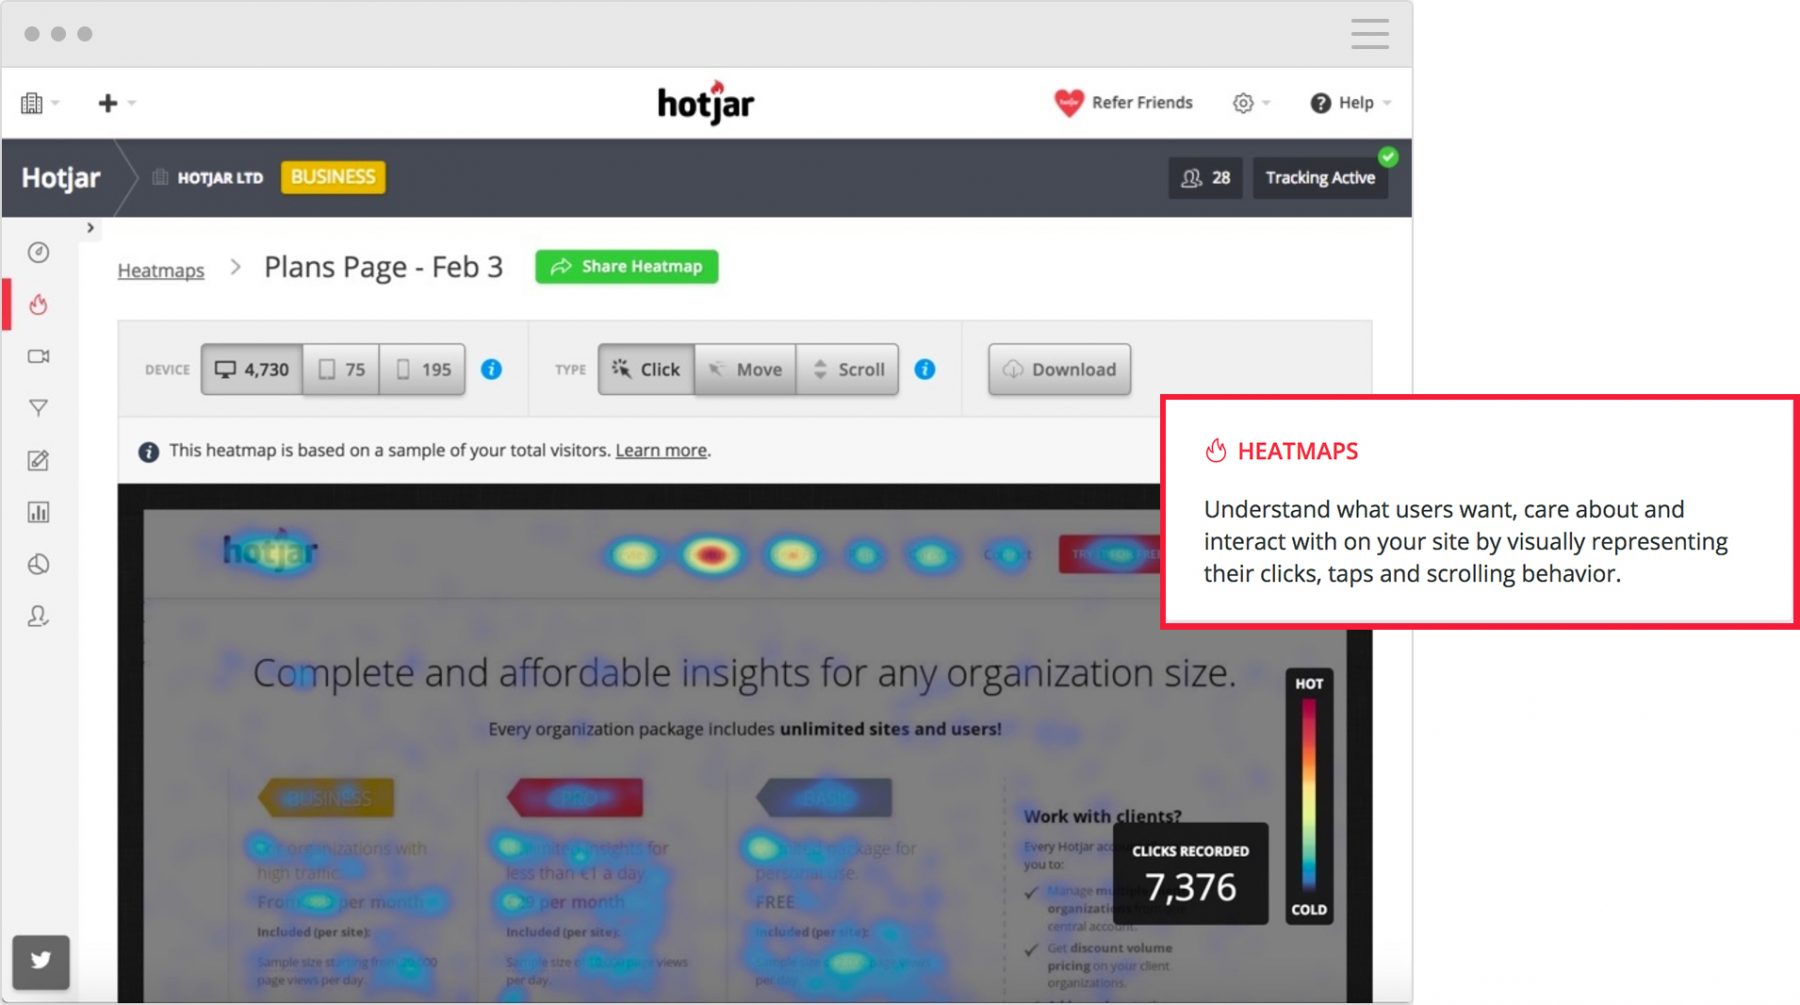
Deducing user experience pitfalls from this feature alone can provide beneficial information. This information can help you change the entire user flow of your website.
For example, perhaps you have an array of services represented with text and icons. These sit in the middle of your site but don’t link to any internal pages. In Hotjar’s heatmap, you can see if users are clicking these icons. Are they expecting to be taken to another page with more information?
If they are, and it’s a “hot” zone, you can deduce something important. A better user experience would have these areas link off to something else.
Call to actions (CTAs) are great and drive conversion on almost every website. But perhaps the button placement or design isn’t resonating with your users. With heatmaps, you can see what users are clicking instead. You can also see which areas of the website they gravitate towards most.
Like all of Hotjar’s features, heatmaps show you an individual aggregate of sessions. This includes desktop, tablet, and phone separately. Going back to our CTA example, you can tell pretty easily something important. Is a CTA resonating more with a desktop audience than a mobile audience? You can then take steps to correct any flaws that exist.
You can also implement heatmaps on as many or few pages as you’d like. It depends on what’s most important to you.
Modern heatmap tools now use machine learning to identify anomalies automatically. Instead of manually reviewing thousands of sessions, both Hotjar and Clarity flag high-frustration recordings. These include rage clicks, dead clicks, and u-turns. You focus on the 50 sessions that matter most, saving 15-20 hours per week.
Keep in mind that to get the entire story with heatmaps, something is key. You need a large enough user base to see the “big picture.” How much traffic does your site receive on a daily or weekly basis? It’s a good idea to only start making deductions after a certain time has passed. One to two weeks is a good rule of thumb.
Visitor Recordings
Get the popcorn ready! Hotjar’s visitor recordings allow you to watch just about every action a user makes on your website. You’ll get to see a real-time play by play of user actions and decisions as they navigate through your website. With this tool, you’ll receive first-hand knowledge of your website’s pitfalls. You can see what areas of your website users focus on the most, what areas they ignore, and most importantly what actions they take on the website before leaving completely.
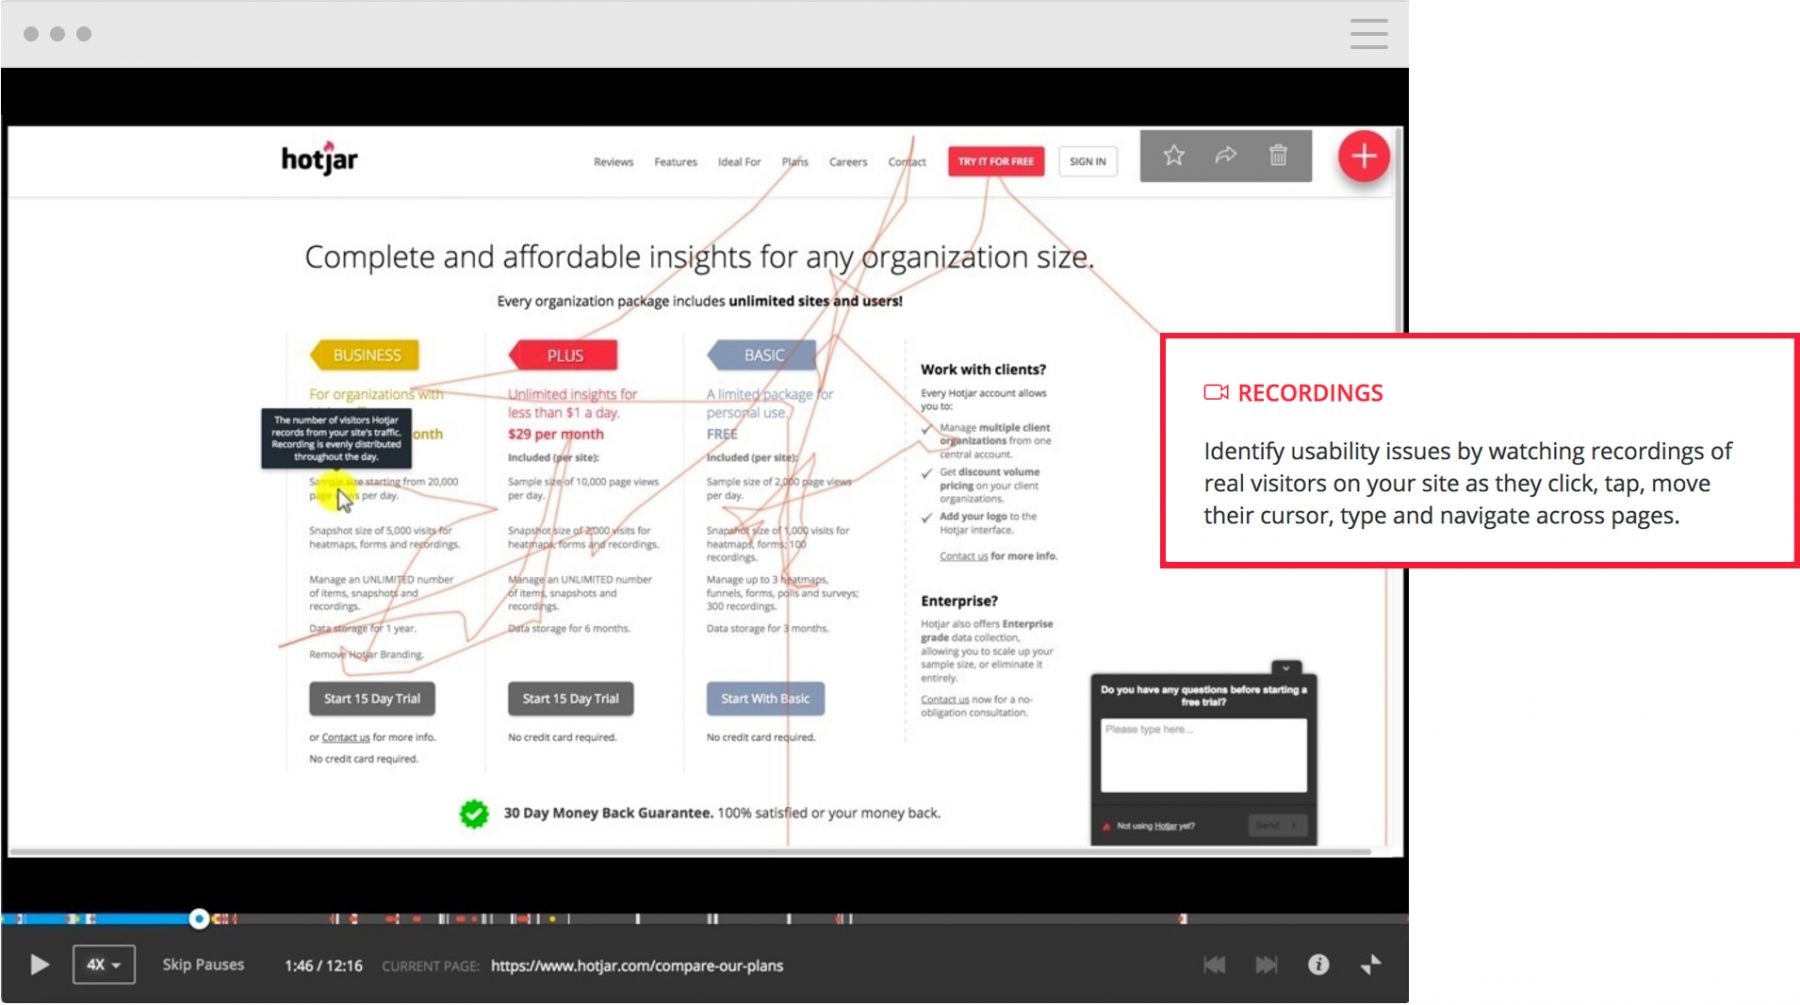
This tool also comes in handy if you (unknowingly) have issues with your website’s load time, broken links/pages, or mobile compatibility. What works on your device may not work on somebody else’s, and if your quality assurance testing failed before launch, this tool can help you find these little problems that could be causing big user experience issues.
Believe it or not, visitor recordings can even help you understand whether or not the language you’re using on your website is confusing, misleading or missed by users. Since these are all real-time recordings, you can see mouse movements as users browse through your site. You’ll be able to tell if a user is hovering over a piece of content too long (or missing important messaging altogether), and depending on the actions they take after that, you can deduce what correlation the content had on their next action.
If you’re looking to really get down to the nitty-gritty, Hotjar allows you to sort and filter visitor recordings based on a number of attributes. This can be especially helpful if you are looking for feedback from very specific users depending on their website entry page, how many pages they visited, device, operating system, and much more.
We recommend having a large enough sample of visitor recordings before deciding whether or not you have a major (or even minor) user experience issue on your site. Spotting repeated actions by several different users can give you a good insight as to whether or not something needs to be changed.
Session replay tools now operate in “privacy mode” by default. All form inputs are masked, sensitive data (SSNs, credit cards, passwords) automatically redacted, and IP addresses anonymized—meeting GDPR and CCPA requirements. Both Hotjar and Clarity offer “strict mode” to block recording entirely on sensitive pages (payment forms, account settings).
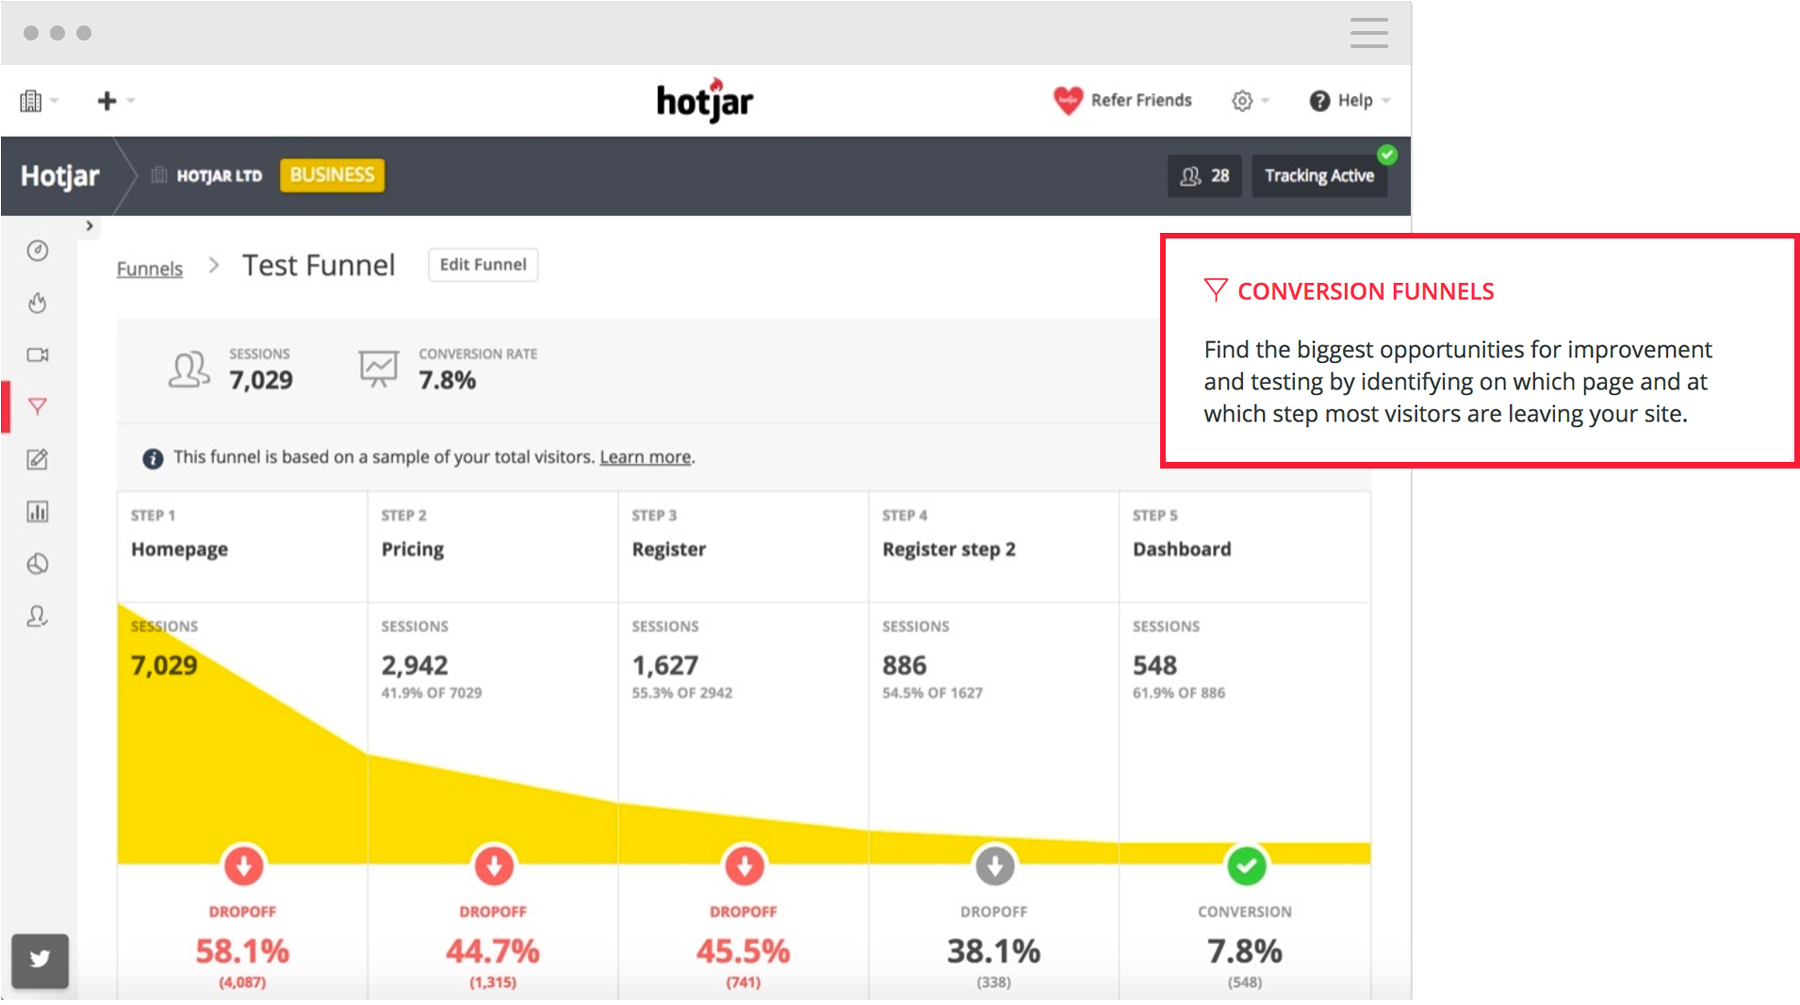
Conversion Funnels
At this point, it’s easy to get overwhelmed with all the user data Hotjar provides. Prioritizing where you begin understanding user actions can sometimes be key, especially if you have a large website with a large amount of traffic.
This is where Hotjar’s conversion funnel feature will help. Building funnels will help you recognize where the biggest website drop offs are coming from, and give you a clear understanding of what you should focus on first when making changes.
For teams looking for an alternative approach to funnel analysis, Microsoft Clarity offers a completely free funnel tracking feature that integrates seamlessly with other Microsoft products. While Hotjar provides more advanced customization options, Clarity’s funnel insights can be a great starting point for budget-conscious teams.
Since this is a little bit more of an advanced Hotjar feature that requires a decent amount of thought and time to setup correctly, we recommend checking out Hotjar’s extensive tutorial on how to get it right. Overall, Hotjar’s documentation is very in-depth and helpful for understanding user actions, even if you don’t have Hotjar installed just yet!
Forms
Finally, the last piece to Hotjar’s “analysis” tool arsenal is Forms. With forms, you can easily detect drop off points from when users begin to fill out a form on your website to when they click “submit.”
This tool will help you understand whether or not a form is too long or which information users don’t want to provide. Ultimately, you’ll be able to fine-tune your form for best possible conversion. Both Hotjar and Clarity provide extensive documentation on setting up form tracking. Once you’re comfortable, their usability is fool-proof.
Time to Get Analyzing
Whether you think your website has user experience pitfalls or not, Hotjar’s analysis tools will probably give you some serious surprises. We recommend starting small in your Hotjar journey. Gradually expand the number of heatmaps or visitor recordings you use as time goes on. This will help with the overall learning curve. It will also help you understand which features of each tool matter most to you.
If you’re just starting out with behavior analytics, consider testing the waters before committing to a paid tool. Microsoft Clarity provides many similar features – including heatmaps, session recordings, and funnel analysis completely free. This can be an excellent way to build your analytics foundation before upgrading to Hotjar’s more advanced capabilities.
In part two of our in-depth Hotjar series, we’ll be focusing on “feedback” tools. These tools give you a direct line to your users. You can ask them to contribute instant experience feedback, polls, and expanded user experience surveys. You can even recruit users to take part in live usability testing. This provides you with direct feedback on any current or future iterations.
Which Tool Is Right for You?
Are you an enterprise brand with complex needs across heatmapping, dashboarding, funneling, and surveying? If you have the budget, Hotjar is an excellent choice. Its advanced features and comprehensive feedback tools make it worth the investment for serious optimization teams. Just keep in mind one important detail: if you manage multiple websites, you’ll need separate plans for each one.
However, you might just need a solid core set of heatmapping, recording, and funnel-tracking tools. If that’s the case, Microsoft Clarity is hard to beat. It costs zero dollars and continuously updates its features. Clarity delivers impressive functionality that rivals paid alternatives. For small to medium-sized businesses or analytics beginners, Clarity offers an excellent starting point.
Finally, if you find yourself struggling to set up Hotjar or understand the results you’re seeing, our team at Newbird would be happy to help. Contact us today!